There already exists many server monitoring and logging systems, but I was interested to develop and deploy my own. It was also a good chance to learn about ElasticSearch's aggregation queries (new in v1.0.0). Originally ElasticSearch was designed to provide scalable document based storage and efficient search, but now it is gaining more capabilities. The project consists of a cron job which pushes new metrics to ElasticSearch, a RESTful JSON API to query statistics on recorded numbers and plot the results in a browser (based on HighCharts).
The cron job is scheduled to produce a new dump of computer's sensor data, disk S.M.A.R.T. data, temperatures, disk usage and so forth into a text file on the disk. Then it is parsed by PHP, converted into a "document" and stored into ElasticSearch. The ElasticSearch's "schema" is designed to support log items from multiple machines, multiple disks / machine and so forth.

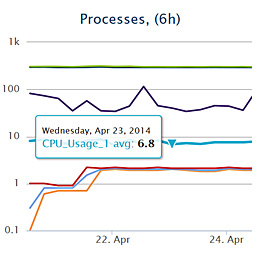
Example graphs are shown in figures 1 and 2. These are generated by a static HTML5/JS file, and the UI generation is fully driven by API's responses. The exposed API consists of RESTful URLs such as /api/smart/6h to get S.M.A.R.T. aggregated at 6 hour intervals.

HTTP requests are handled by a PHP script which constructs the corresponding ElasticSearch aggregation query, transforms the response into the desired structure structure and generates the JSON response. ElasticSearch is able to aggregate 500k documents in 150 milliseconds, thanks to good caching and an efficient implementation. It will be interesting to use it in future projects as well. This library is available at GitHub.com/nikonyrh/elasticaggregator-php.
Related blog posts:
|
|
|
|
|
|
|
|
|
|


