

When developing RESTful APIs, it is important to know how many requests per minute the end point is able to serve. Because of my interest in Nginx, FastCGI and multi-threaded C+++, I decided to develop my own in-broser HTTP load tester which supports easy configuration, any number of parallel load-generating worker threads and real-time graphing based on jQuery powered HighCharts library.
The project started as a simple command line utility written in C++, which used pthreads for multi-threading and happyhttp for sending and receiving HTTP packets. Configuration is done by command line parameters, and the final output is written into a text file. Implemented configuration flags are:
- -accept: A list of accepted first characters of a valid response, default '*' (matches everything)
- -hostname: Host name of the target, default 'localhost'
- -incremental: Incremental route generation (an advanced feature), default no
- -limit: The worker thread's query limit (x / minute), default 100
- -output: Path of the final results file, default '/dev/null'
- -port: Connection port, default 80
- -route: Request route (appended after the host name), default '/'
- -time: How long the test should be run (in seconds), default 2
- -verbose: Display verbose output, default no
- -workers: Number of parallel worker threads, default 1
The total query rate is the "queries / minute / worker" × "number of workers". For example setting "limit = 100" and "workers = 24" would set the target query rate at 2400 queries / minute (or 40 / second). The number of worker threads doesn't affect much the memory usage, because configurations and other needed objects are distributed to workers via const pointers.
The program supports quite flexible route definitions, most importantly random parameter generation. The syntax resembles regular expressions, where you can define a range of characters to use and the token length. For example "/?search=[a-z]{4}_[0-9]{3}" would generate routes such as "/?search=jiec_568", "/?search=bbdw_968" and "/?search=coux_937". Clearly the route has a fixed pattern, with four random characters a - z and three characters 0 - 9. This avoids incorrect measurements due to caching effects.
An other simulated case is when a user is typing in a search term, in which case the API sees incrementally lengthening query terms. This is achieved by setting =true and adding a special token (vertical pipe |) to the route definition. For example "/?q=|[a-z]{2}_[0-9]". This may generate the following HTTP GET sequence: "/?q=d", "/?q=dl", "/?q=dl_", "/?q=dl_5", "/?q=g", "/?q=gq", "/?q=gq_", "/?q=gq_6". The randomly generated parts are dl_5 and gq_6, but they are incrementally constructed and queried.
This is an example summary of the percentiles for two workers running for 20
seconds:
Worker 1, executed 34 requests (50th 0.032 sec, 95th 0.063 sec,
99th 0.063 sec)
Worker 2, executed 33 requests (50th 0.028 sec, 95th
0.051 sec, 99th 0.051 sec)
Finished after 19.8643 seconds,
totalled 67 success and 0 failures.
25th 0.025 sec
50th 0.030 sec
90th 0.040 sec
95th 0.051 sec
99th 0.063 sec
To make the tool more user friendly and to provide graphing capabilities, I decided to develop a FastCGI wrapper for it. It was easy to configure Nginx HTTP server to route requests to the FastCGI process, which generates either HTML or JSON responses. The basic FastCGI functionality is achieved by using the libfcgi library and and spawn-fcgi utility program.
The first challenge was to implement per-tab sessions, because I wanted any number of users to have any number of independent sessions active simultaneously. This is achieved by not using the standard session approach (per-domain cookies), but instead carrying the SESSID attribute in GET and POST parameters. Additionally each session times out in mere five seconds, and it is kept alive by an once-a-second AJAX call. Each AJAX call has a unique AJAXID as well, and the new id is generated on the server side upon each request and is sent back to the client program. When a session dies out, all session-specific memory needs to be correctly freed to avoid memory leaks.
When the client starts the load tester, new threads are started on the server side which are run on the back ground. Then the client's only remaining task is to poll for new results. The user may even refresh the browser window, and it won't affect the background test execution.
An other challenge was to choose and utilize a suitable HTML temple engine. I had prior experience with cross-language cross-markup logic-less template system Mustache. It is already implemented for C++ (see Plustache), but it depended on Boost's Regex and was missing a few features. I developed a simple Mustache tokenizer and output generator without external dependencies in ~440 lines of code.
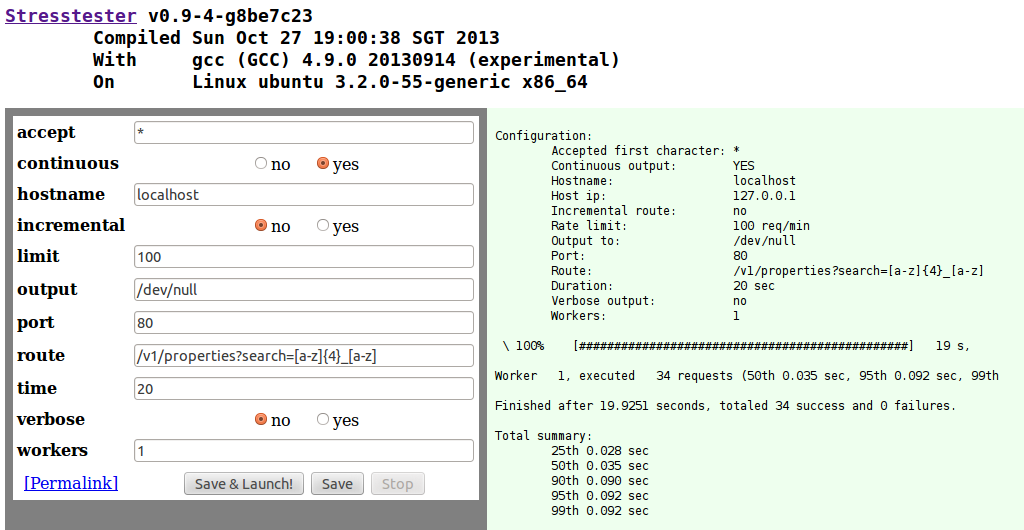
The HTML input form is automatically generated from the internal configuration of the load tester configuration class, which is also used for parsing the command line arguments. This ensures that there is only one implementation of the program configuration, and that the two alternate options are internally identical and compatible. This is seen in figure 1. It has one additional configuration flag "continuous", which affects whether the result graphs at the bottom are updated real-time or only when the test finishes.
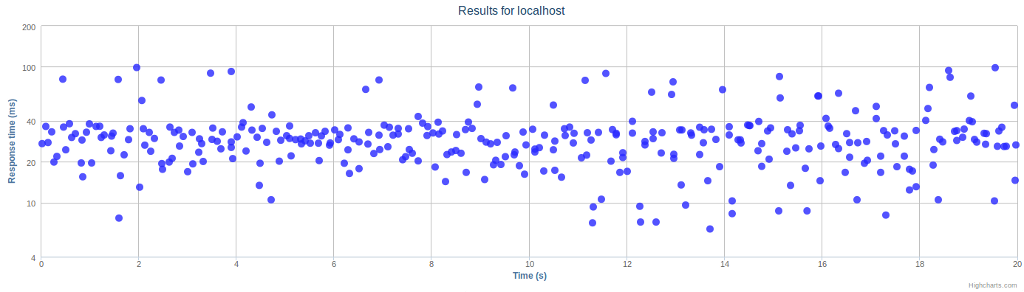
The biggest advantage over the command line interface is the possibility of utilizing jQuery and any of the numerous graphing libraries out there. Earlier I have used Google Charts, but this time I wanted to test out the newer Highcharts library. The current version of the project provides three views on the performance results, and the first of them is shown in Figure 2. It displays each individual request's response time on a linear time axis and logarithmic response time axis.
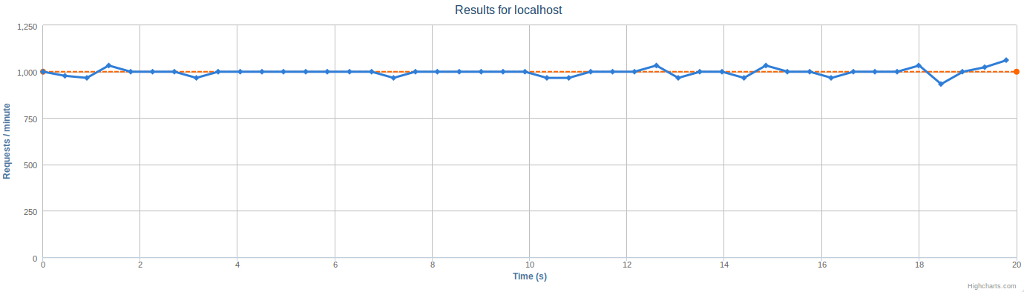
The second graph is shown in Figure 3. From this graph we can confirm that the target request rate per minute was indeed achieved. There are small random deviations, but overall we can see that the achieved request rate was very close the to the target.
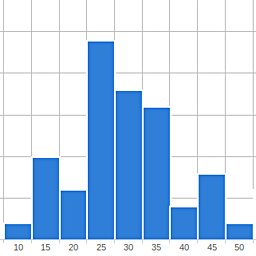
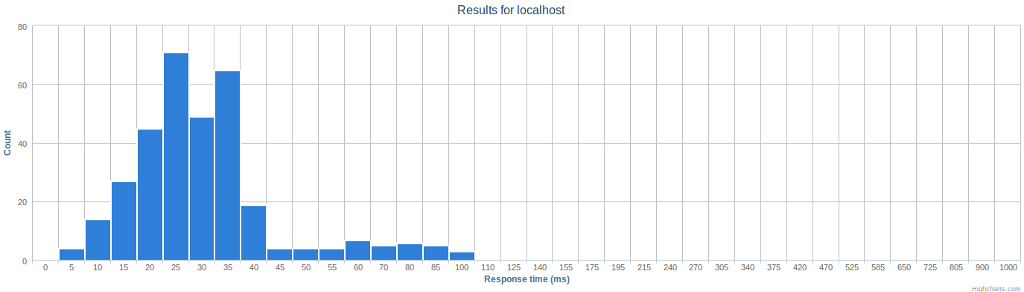
The final graph is shown in Figure 4. It summarizes the response times on a histogram with fixed bins, ranging from 0 to 1000 milliseconds. From this we can easily estimate the median being at around 25 - 30 milliseconds, and that small percentage of responses took 50 - 100 milliseconds.
Related blog posts:
|
|
|
|
|
|
|
|
|
|
